2 Data Basics
2.1 Objectives
Define and use properly in context all new terminology, to include: case, observational unit, variables, data frame, associated variables, independent, and discrete and continuous variables.
Identify and define the different types of variables.
Given a study description, describe the research question.
In
R, create a scatterplot and determine the association of two numerical variables from the plot.
2.2 Homework
2.2.1 Problem 1
Identify study components. Identify (i) the cases, (ii) the variables and their types, and (iii) the main research question in the studies described below.
Researchers collected data to examine the relationship between pollutants and preterm births in Southern California. During the study, air pollution levels were measured by air quality monitoring stations. Specifically, levels of carbon monoxide were recorded in parts per million, nitrogen dioxide and ozone in parts per hundred million, and coarse particulate matter (PM\(_{10}\)) in \(\mu g/m^3\). Length of gestation data were collected on 143,196 births between the years 1989 and 1993, and air pollution exposure during gestation was calculated for each birth. The analysis suggests that increased ambient PM\(_{10}\) and, to a lesser degree, CO concentrations may be associated with the occurrence of preterm births.2
The cases are 143,196 eligible study subjects who were born in Southern California between 1989 and 1993.
The variables are measurements of carbon monoxide (CO), nitrogen dioxide, ozone, and particulate matter less than 10\(\mu m\) (PM10) collected at air-quality-monitoring stations, as well as length of gestation. All of these variables are continuous numerical variables.
The research question: Is there an association between air pollution exposure and preterm births?
The Buteyko method is a shallow breathing technique developed by Konstantin Buteyko, a Russian doctor, in 1952. Anecdotal evidence suggests that the Buteyko method can reduce asthma symptoms and improve quality of life. In a scientific study to determine the effectiveness of this method, researchers recruited 600 asthma patients aged 18-69 who relied on medication for asthma treatment. These patients were split into two research groups: patients who practiced the Buteyko method and those who did not. Patients were scored on quality of life, activity, asthma symptoms, and medication reduction on a scale from 0 to 10. On average, the participants in the Buteyko group experienced a significant reduction in asthma symptoms and an improvement in quality of life.3
The cases are 600 adult patients aged 18-69 years who have been diagnosed and are currently being treated for asthma.
The variables are whether or not the patient practiced the Buteyko method (categorical) and measures of quality of life, activity, asthma symptoms and medication reduction of the patients (categorical, ordinal). It may also be reasonable to treat the ratings on a scale of 1 to 10 as discrete numerical variables.
The research question: Do asthmatic patients who practice the Buteyko method experience improvement in their condition?
2.2.2 Problem 2
In the openintro package is a data set called ames, containing information on individual residential properties sold in Ames, IA between 2006 and 2010. Create a scatterplot for the above ground living area square feet versus sale price in US dollars. Describe the relationship between these two variables. Note: you may have to load the library and data set.
Load the library:
Load the data set:
data(ames)Create the scatterplot.
ames %>%
  gf_point(price ~ area)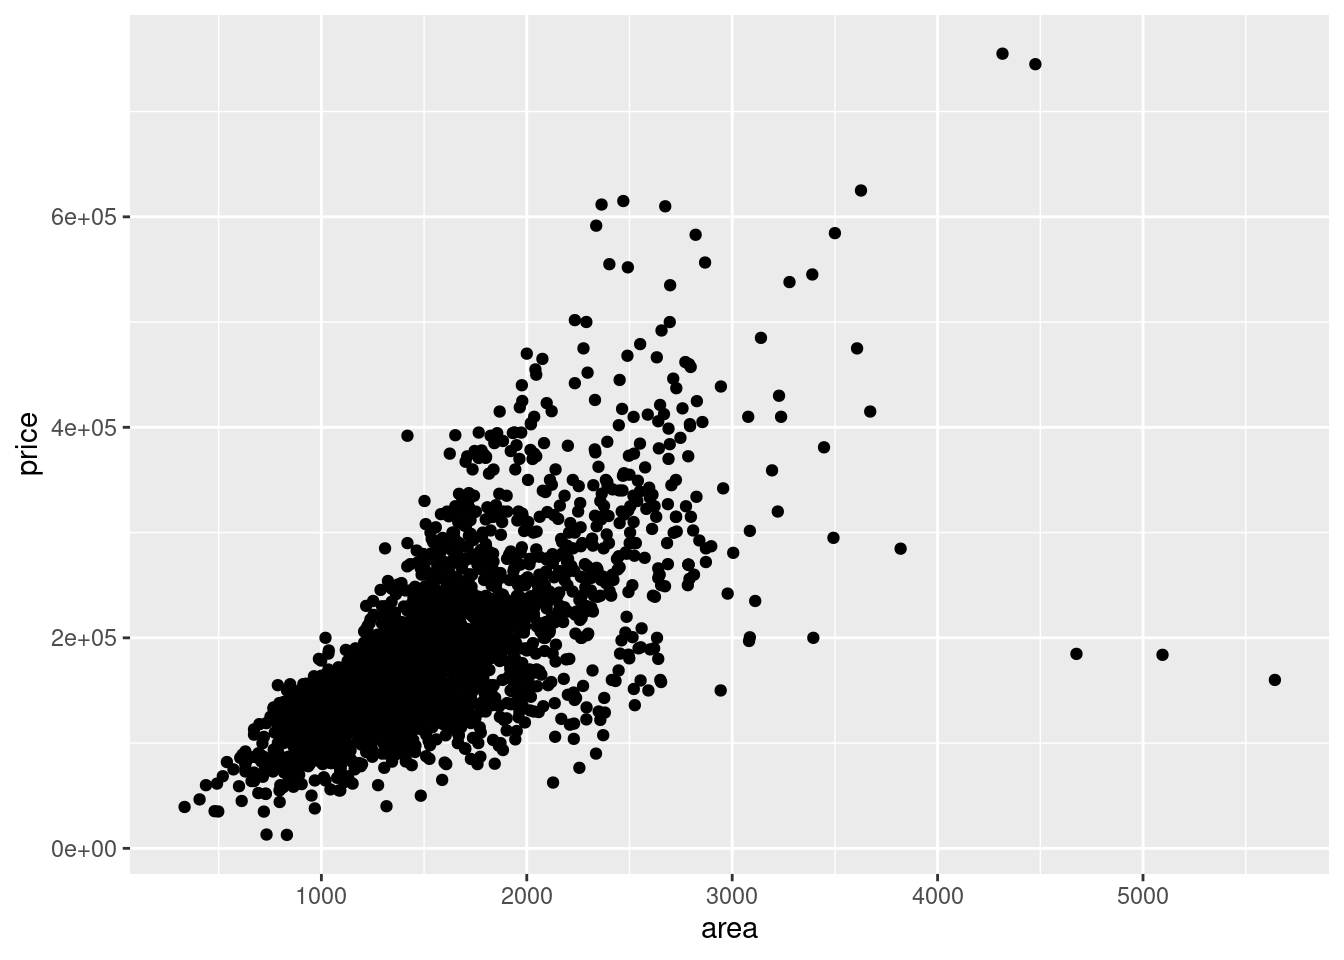
There appears to be a positive association between the above ground living area square feet and sale price of a residential property in Ames, IA.