1 Case Study
1.1 Objectives
Use
Rfor basic analysis and visualization.Compile a pdf file report from a RMD file in R.
1.2 Homework
Load the tidyverse, mosaic, and knitr packages.
1.2.1 Problem 1
Stent study continued. Complete a similar analysis for the stent data, but this time use the one year outcome. In particular,
- Read the data into your working directory.
stent_study <- read_csv('data/stent_study.csv')- Complete the steps below. The start of code is provided below. You will need to add
{r}to the start of each code chunk or insert your own code chunks to use the code.
i. Use `inspect` on the data.
inspect(stent_study)##
## categorical variables:
## name class levels n missing
## 1 group character 2 451 0
## 2 outcome30 character 2 451 0
## 3 outcome365 character 2 451 0
## distribution
## 1 control (50.3%), trmt (49.7%)
## 2 no_event (89.8%), stroke (10.2%)
## 3 no_event (83.8%), stroke (16.2%)This shows the different variables and their types.
ii. Create a table of `outcome365` and `group`. Comment on the results.
tally(outcome365 ~ group, data = stent_study, format = "proportion", margins = TRUE)## group
## outcome365 control trmt
## no_event 0.8766520 0.7991071
## stroke 0.1233480 0.2008929
## Total 1.0000000 1.0000000Patients in the treatment group had a higher proportion of strokes than those in the control group after one year. The treatment does not appear to help the rate of strokes and, in fact, may hurt it.
iii. Create a barchart of the data.
stent_study %>%
  gf_props(~group, fill = ~outcome365, position = 'fill') %>%
  gf_labs(title = "Impact of Stents on Stroke",
          subtitle = 'Experiment with 451 Patients',
          x = "Experimental Group",
          y = "Proportion of patients")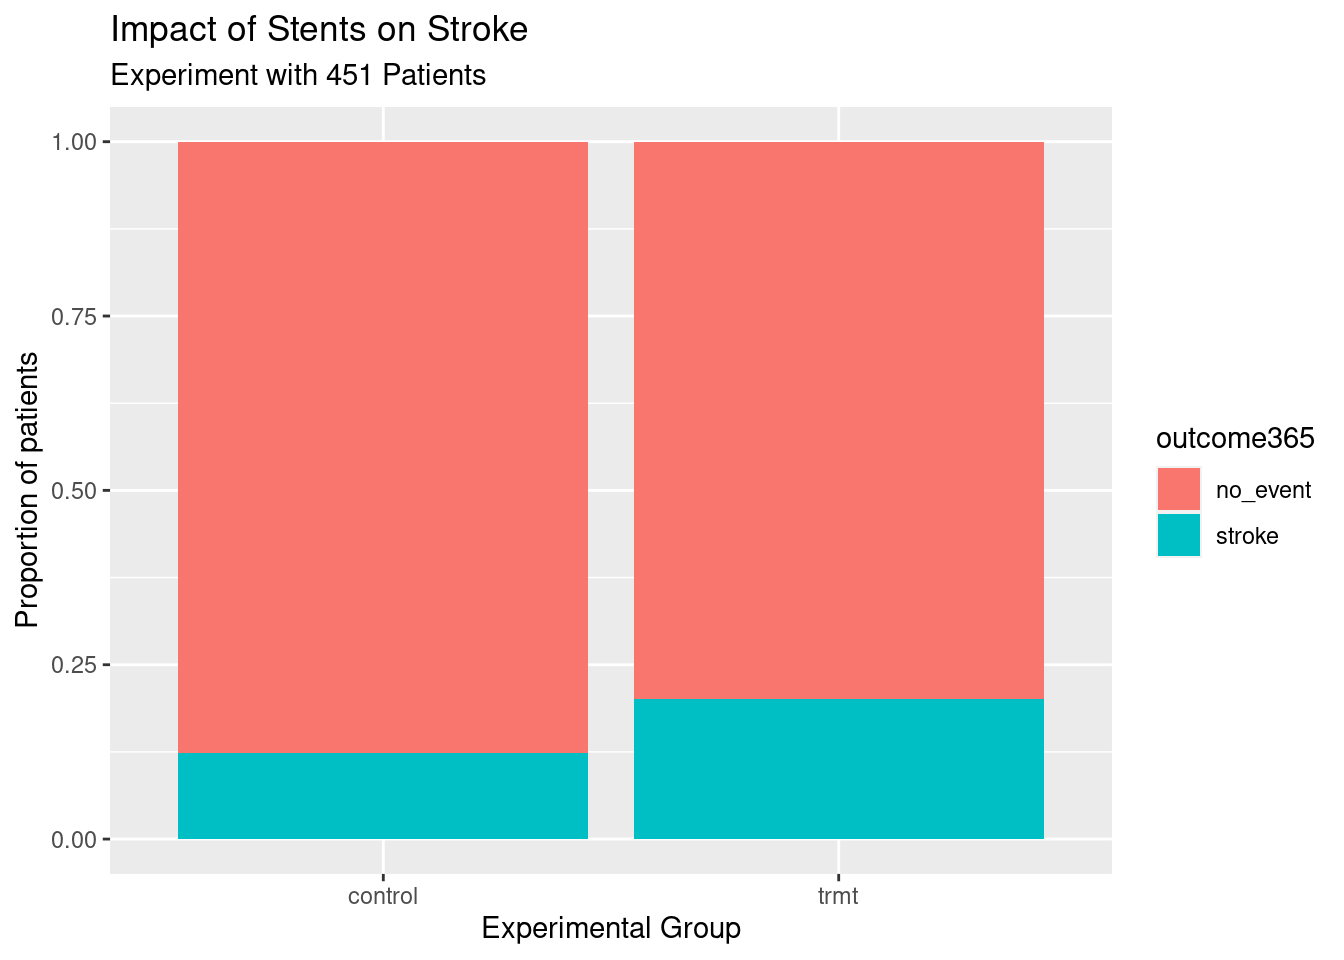
1.2.2 Problem 2
Migraine and acupuncture. A migraine is a particularly painful type of headache, which patients sometimes wish to treat with acupuncture. To determine whether acupuncture relieves migraine pain, researchers conducted a randomized controlled study where 89 females diagnosed with migraine headaches were randomly assigned to one of two groups: treatment or control. The 43 patients in the treatment group received acupuncture that is specifically designed to treat migraines. The 46 patients in the control group received placebo acupuncture (needle insertion at non-acupoint locations). Then 24 hours after patients received acupuncture, they were asked if they were pain free.1
The data is in the file `migraine_study.csv` in the `data` folder. Complete the following work:- Read the data into an object called
migraine_study.
migraine_study <- read_csv("data/migraine_study.csv")
head(migraine_study)## # A tibble: 6 × 2
## group pain_free
## <chr> <chr>
## 1 treatment yes
## 2 treatment yes
## 3 treatment yes
## 4 treatment yes
## 5 treatment yes
## 6 treatment yes- Create a table of the data.
tally(pain_free ~ group, data = migraine_study,
      format = "proportion", margin = TRUE)
## group
## pain_free control treatment
## no 0.95652174 0.76744186
## yes 0.04347826 0.23255814
## Total 1.00000000 1.00000000- Report the percent of patients in the treatment group who were pain free 24 hours after receiving acupuncture.
There were 23.2% of the treatment group who were pain free.
- Repeat for the control group.
There were 4.3% of the control group who were pain free.
- At first glance, does acupuncture appear to be an effective treatment for migraines? Explain your reasoning.
Yes, there was a substantially larger percentage of patients who were pain free after receiving acupuncture versus those who did not receive acupuncture, so it appears to be effective.
- Do the data provide convincing evidence that there is a real pain reduction for those patients in the treatment group? Or do you think that the observed difference might just be due to chance?
Either of these is acceptable:
We could get slightly different group estimates even if there is no real difference. Though the difference is big, I’m skeptical the results show a real difference and think this might be due to chance.
The difference in these rates looks pretty big, and so I suspect acupuncture is having a positive impact on pain.
- Compile,
knit, this report into an html and a pdf. In order toknitthe report into a pdf, you may need to install theknitrandtinytexpackages inR.
Complete on your computer or RStudio Cloud. Knit the report by clicking the Knit button and choose either the “Knit to HTML” or “Knit to PDF” option from the drop down menu.